● 차트만들기
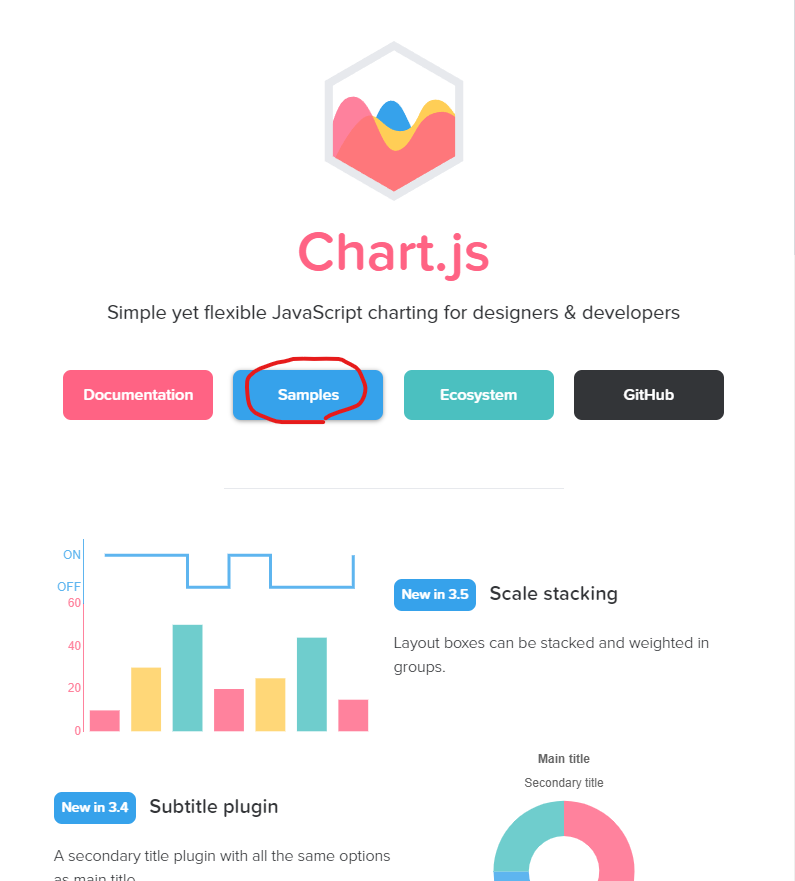
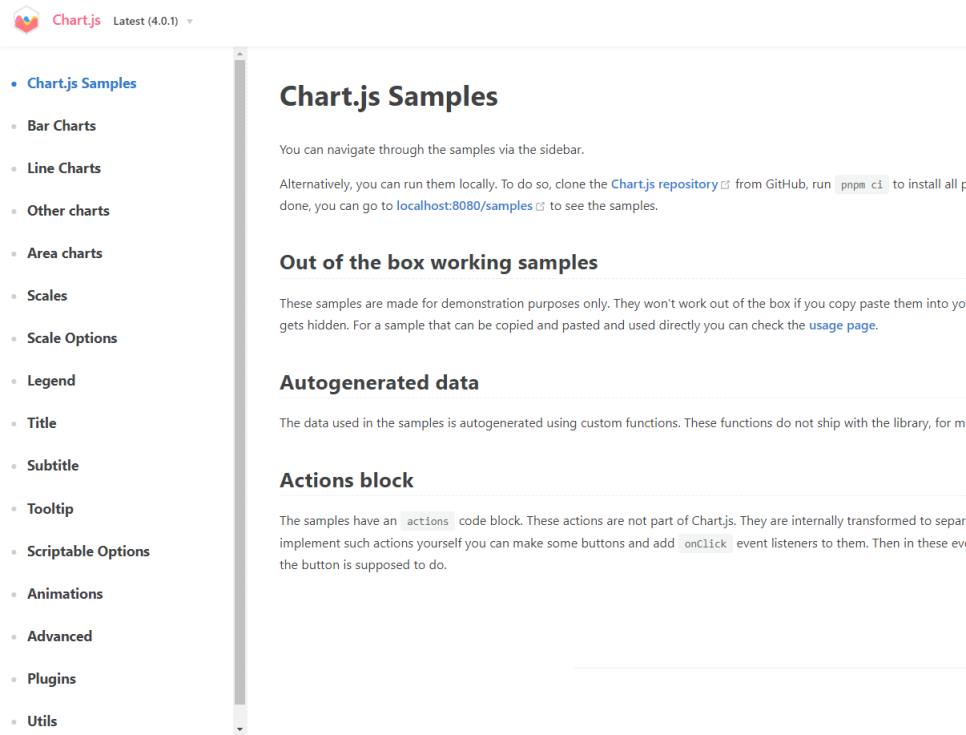
왼쪽의 사이드바에서 쓰고 싶은 차트를 선택
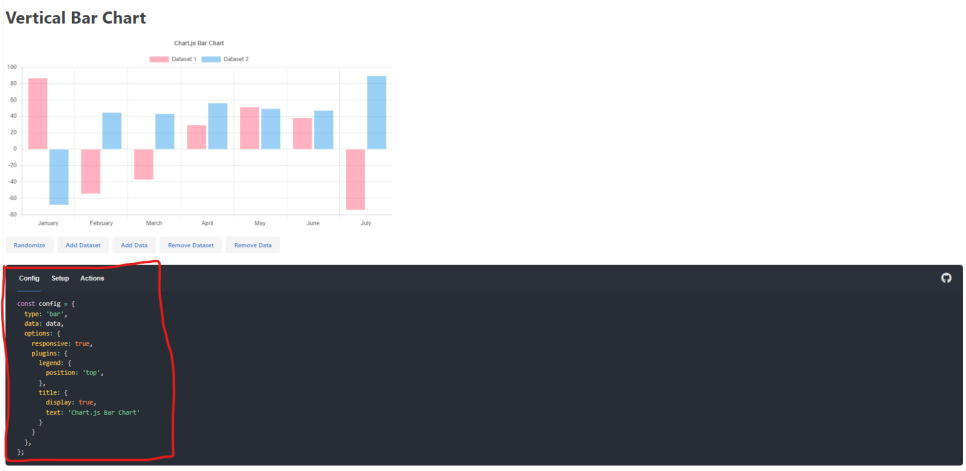
Vertical Bar Chart에서 밑의 Sample코드를 복사해서 사용
<!DOCTYPE html>
<html lang="en">
<head>
    <meta charset="UTF-8">
    <meta http-equiv="X-UA-Compatible" content="IE=edge">
    <meta name="viewport" content="width=device-width, initial-scale=1.0">
    <title>Document</title>
    <!-- Chart.js CDN -->
    <script src="https://cdnjs.cloudflare.com/ajax/libs/Chart.js/2.4.0/Chart.min.js"></script>
</head>
<body>
    <canvas id="myChart" width="400" height="400"></canvas>
<script>
const ctx = document.getElementById('myChart').getContext('2d');
const myChart = new Chart(ctx, {
    // 차트의 형태 (bar, line ,pie등)
    type: 'line',
    data: {// 차트에 들어갈 데이터
        labels: ['Red', 'Blue', 'Yellow', 'Green', 'Purple', 'Orange'],
        // labels: x축에 들어갈 데이터
        datasets: [{
            label: '# of Votes', // 차트의 제목
            data: [12, 19, 3, 5, 2, 3],
            // x축 labels에 대응되는 데이터 값
            backgroundColor: [
                'rgba(255, 99, 132, 0.2)',
                'rgba(54, 162, 235, 0.2)',
                'rgba(255, 206, 86, 0.2)',
                'rgba(75, 192, 192, 0.2)',
                'rgba(153, 102, 255, 0.2)',
                'rgba(255, 159, 64, 0.2)'
            ],
            borderColor: [
                'rgba(255, 99, 132, 1)',
                'rgba(54, 162, 235, 1)',
                'rgba(255, 206, 86, 1)',
                'rgba(75, 192, 192, 1)',
                'rgba(153, 102, 255, 1)',
                'rgba(255, 159, 64, 1)'
            ],
            borderWidth: 1
        }]
    },
    options: {
        scales: {
            y: {
                beginAtZero: true
            }
        }
    }
});
</script>
</body>
</html>
<head>
<script src="https://code.jquery.com/jquery-3.6.0.min.js">
<!-- Chart.js CDN -->
<script src="https://cdnjs.cloudflare.com/ajax/libs/Chart.js/2.4.0/Chart.min.js">
# jquery 파일을 추가합니다
Chart.min.js 파일과 utils.js 파일은 아래에 첨부
<style>
canvas{
width: 400px !important; # 너비와 높이를 우선적용하여 고정
height: 500px !important;
}
</style>
[CSS] !important 활용
중요하다는 표시로 어떤 경우에나 이것이 우선 적용 되도록 하고 싶을 때 사용한다.
예를들어서
important 사용법 : { 속성 : 속성값 !important; }CSS를 다음과 같이 했을 경우
* { color: #000 !important }
.white { color: #fff }
<span class="white">Helloworld</div>CSS는 절차지향(순차지향)적인 언어이기때문에
모든 텍스트의 색상을 검정으로 적용하기를 제일 상단에 해놨지만,
제일 하단에 white란 클래스 일경우에는 텍스트 색상을 하얀색으로 적용하라고 제시해놨기 때문에
Helloworld는 하얀색으로 나와야함.
하지만 important를 사용하므로써 (어떤 경우에도 우선 적용되기때문에) Helloworld는 검정색으로 나올것이다.
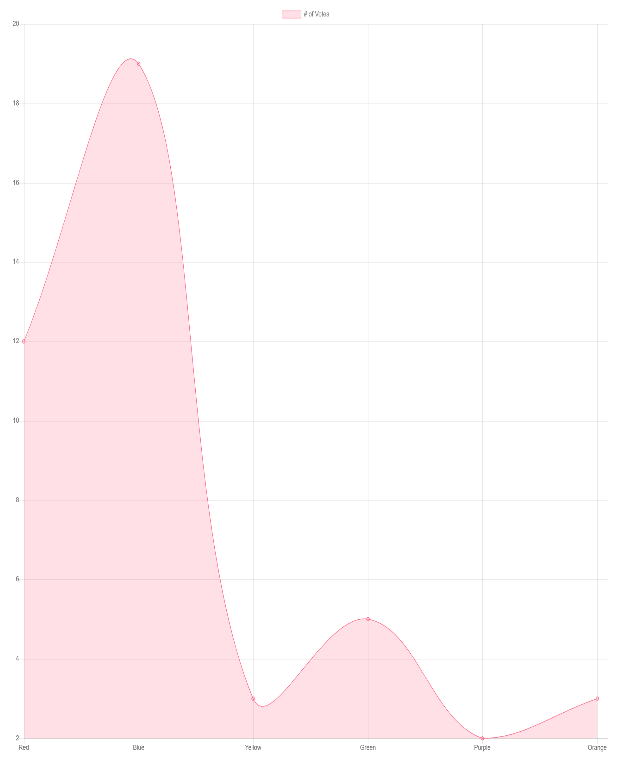
결과)
● 날씨 차트 만들기
기상청 오픈API 사이트
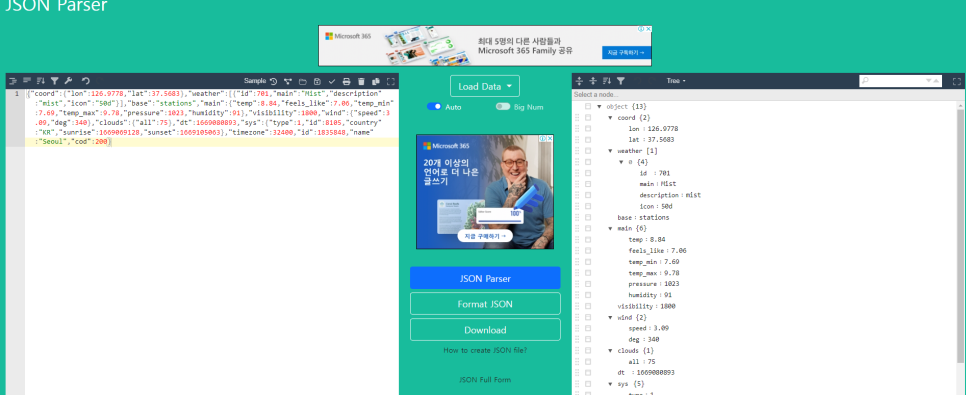
- 경도 위도에 따른 온도, 최저기온, 최고기온, 습도, 풍량, 구름등의 정보를 Key값과 Value값으로 알 수 있다.
<!DOCTYPE html>
<html lang="en">
<head>
    <meta charset="UTF-8">
    <meta http-equiv="X-UA-Compatible" content="IE=edge">
    <meta name="viewport" content="width=device-width, initial-scale=1.0">
    <title>Document</title>
    <script src="https://code.jquery.com/jquery-3.6.0.min.js"></script>
     <!-- Chart.js CDN -->
     <script src="https://cdnjs.cloudflare.com/ajax/libs/Chart.js/2.4.0/Chart.min.js"></script>

     <style>
         canvas{
             width: 400px !important;
             height: 500px !important;
         }
     </style>
</head>
<body>
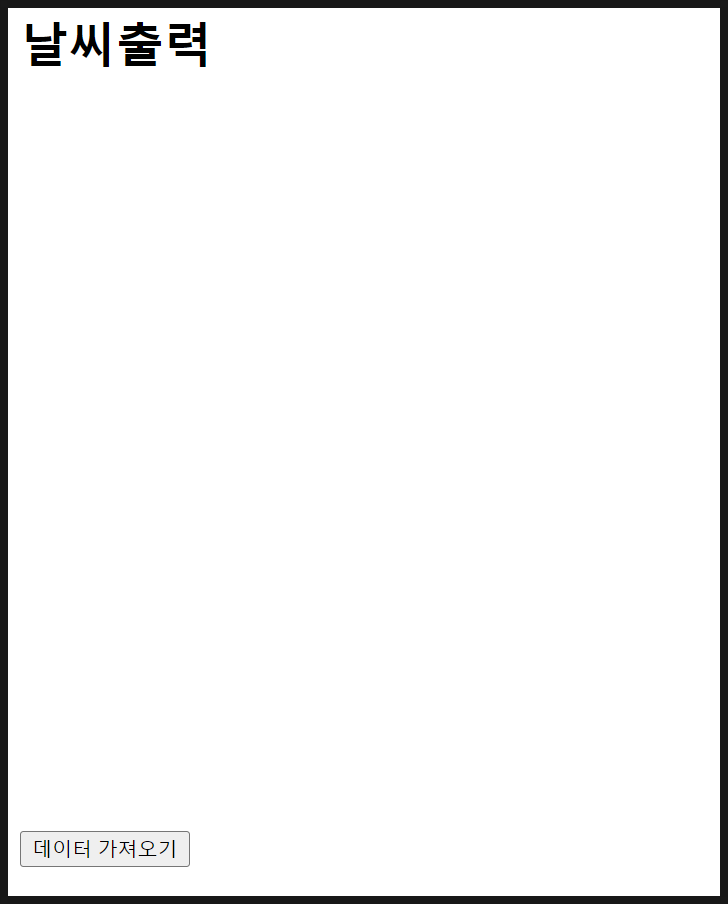
    <h1>날씨출력</h1>
    <button onclick="getData()">데이터 가져오기</button>
    <canvas id="myChart" width="400px" height="400"></canvas>
    <script>
        // 1. 날씨데이터 가지고 오기 => ex01movie.html 참고
        // http://api.openweathermap.org/data/2.5/weather?q=seoul&appid=1eb1d18602c0e2dde562cdc2005a4495&units=metric

        // 2. console 창에 현재 기온, 최고 기온, 최저 기온을 가지고 올것
        // 현재 기온 temp, 최고 기온 temp_max , 최저기온 temp_min
        // 3. 가지고 온 값을 그래프화 => ex03chart.html 참고
        let getData = ()=>{
            //jQuery를 통해 ajax방식으로 데이터를 요청
            $.ajax({
                url:"http://api.openweathermap.org/data/2.5/weather?q=seoul&appid=1eb1d18602c0e2dde562cdc2005a4495&units=metric",
                type: "get",
                success: function(res){
                    console.log(res.main.temp)
                    console.log(res.main.temp_max)
                    console.log(res.main.temp_min)

                    const ctx = document.getElementById('myChart').getContext('2d');
                    const myChart = new Chart(ctx, {
                    // 차트의 형태 (bar, line ,pie등)
                    type: 'bar',
                    data: {// 차트에 들어갈 데이터
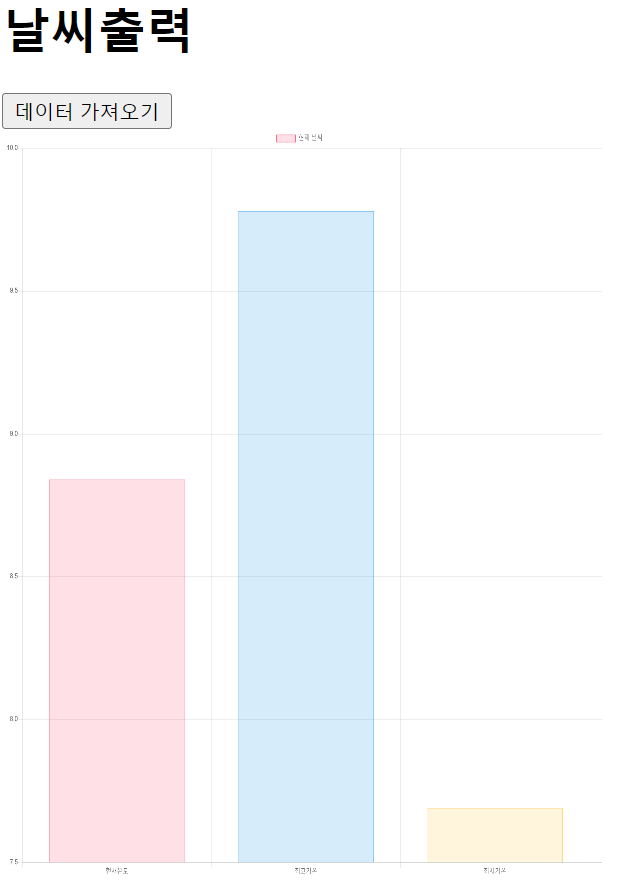
                        labels: ['현재온도', '최고기온', '최저기온'],
                        // labels: x축에 들어갈 데이터
                        datasets: [{
                        label: '현재 날씨', // 차트의 제목
                        data: [res.main.temp, res.main.temp_max, res.main.temp_min],
                        // x축 labels에 대응되는 데이터 값
                        backgroundColor: [
                            'rgba(255, 99, 132, 0.2)',
                            'rgba(54, 162, 235, 0.2)',
                            'rgba(255, 206, 86, 0.2)',
                            'rgba(75, 192, 192, 0.2)',
                            'rgba(153, 102, 255, 0.2)',
                            'rgba(255, 159, 64, 0.2)'
                        ],
                        borderColor: [
                            'rgba(255, 99, 132, 1)',
                            'rgba(54, 162, 235, 1)',
                            'rgba(255, 206, 86, 1)',
                            'rgba(75, 192, 192, 1)',
                            'rgba(153, 102, 255, 1)',
                            'rgba(255, 159, 64, 1)'
                        ],
                        borderWidth: 1
                    }]
                },
                options: {
                    scales: {
                        y: {
                            beginAtZero: false  // 시작점이 0으로 시작할지 설정
                        }
                    }
                }
            });

                },
                error: function(){
                    alert('실패!')
                }
            })
         }
    </script>
</body>
</html>
<head>
<script src="https://code.jquery.com/jquery-3.6.0.min.js">
<!-- Chart.js CDN -->
<script src="https://cdnjs.cloudflare.com/ajax/libs/Chart.js/2.4.0/Chart.min.js">
# jquery 파일을 추가합니다
Chart.min.js 파일과 utils.js 파일은 첨부
<style>
canvas{
width: 400px !important; # 너비와 높이를 우선적용하여 고정
height: 500px !important;
}
</style>
<body>
<h1>날씨출력</h1>
<button onclick="getData()">데이터 가져오기</button>
<canvas id="myChart" width="400px" height="400"></canvas>
1. 날씨데이터 가지고 오기 => ex01movie.html 참고
2. console 창에 현재 기온, 최고 기온, 최저 기온을 가지고 올것
현재 기온 temp, 최고 기온 temp_max , 최저기온 temp_min
3. 가지고 온 값을 그래프화 => ex03chart.html 참고
let getData = ()=>{
//jQuery를 통해 ajax방식으로 데이터를 요청
$.ajax({
url:"http://api.openweathermap.org/data/2.5/weather?q=seoul&appid=1eb1d18602c0e2dde562cdc2005a4495&units=metric",
type: "get",
success: function(res){
console.log(res.main.temp)
console.log(res.main.temp_max)
console.log(res.main.temp_min)
▼
'개발 공부 > JS, JQuery' 카테고리의 다른 글
| !important 선언으로 CSS 스타일 적용 (0) | 2023.11.24 |
|---|---|
| 닷홈 호스팅하는 법(무료 웹 호스팅) (0) | 2023.11.23 |
| Jquery(제이쿼리) 오픈API, Ajax방식으로 데이터를 요청해 json데이터 추출(영화, 지도) (1) | 2023.10.24 |
| 자바스크립트 좋아요 및 댓글작성, 댓글창 (0) | 2023.10.19 |
| 자바스크립트 this 4가지 사용법 (0) | 2023.10.19 |


